BI Reporting Tools Can Make or Break Decision-Making!

Choose a BI Reporting Tool that Tells You What You Need to Know!

The ideal business intelligence and analytics solution includes traditional BI features, modern BI and analytics components and a full suite of reporting capabilities that are easy for your team to use, and will produce clear, concise results for fact-based decision-making.

According to a recent TechJury survey:

  • Data analytics makes decision-making 5x faster for businesses.
  • The top three business intelligence trends are data visualization, data quality management, and self-service business intelligence (BI).
  • 7 out of 10 business rate data discovery as very important.

‘A BI reporting tool that enables users to customize their view and approach and is easy to understand and use will make the user more productive and ensure Return on Investment (ROI).’

If you are considering a Business Intelligence or Augmented Analytics solution, be sure to select a software suite that provides your business users with personalized dashboards, multidimensional key performance indicators, and KPI tools, report software, Crosstab and Tabular reports, GeoMaps and deep dive analytics with 100% browser based interface and self-serve features that encourage and support Social BI and collaboration.
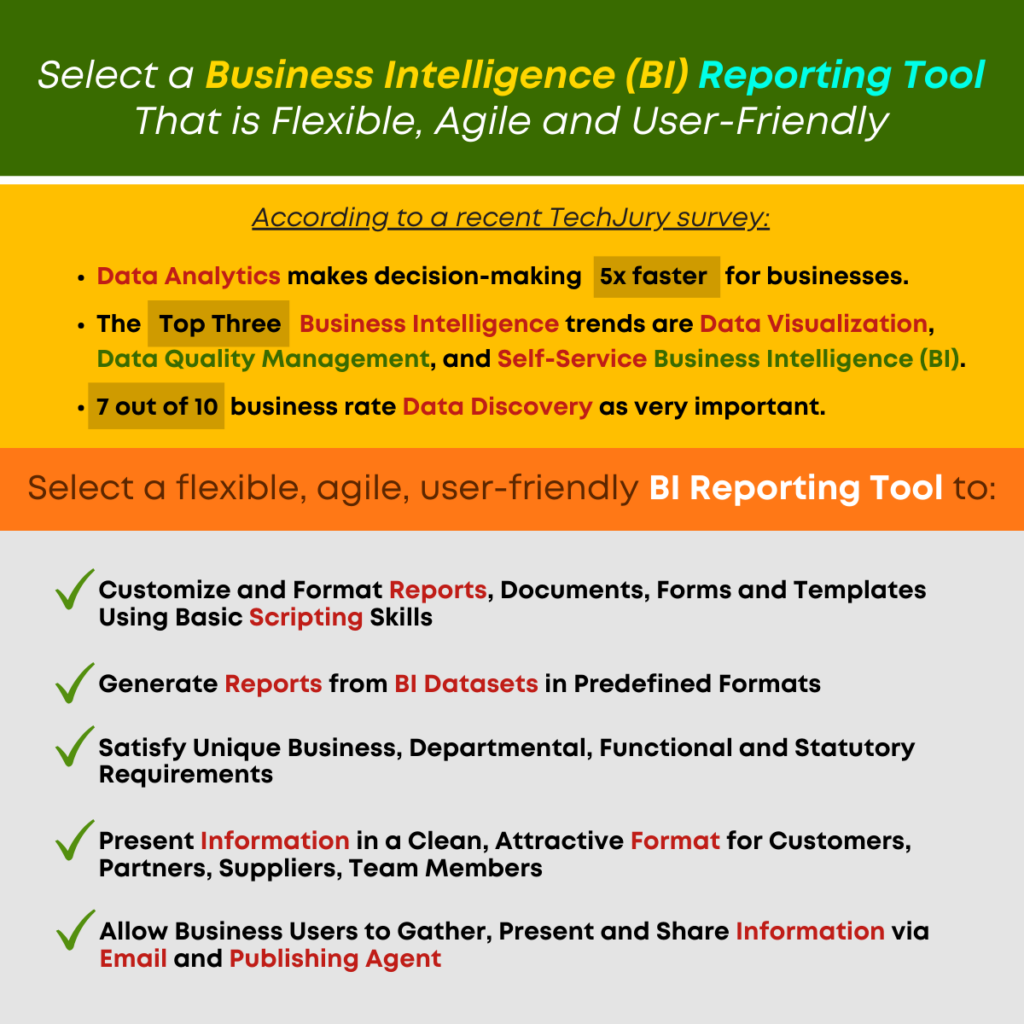
Select a Business Intelligence (BI) Reporting Tool That is Flexible, Agile and User-Friendly

By providing your team access to flexible, agile reporting tools, you increase the probability of user adoption, and improve the outcome, with reports and results that are meaningful to the user, and to the target audience of a presentation or distributed report.

Every business has unique reporting and documentation needs. Whether you are a business user or an analyst or IT professional, you use augmented analytics and BI tools in a way that is meaningful to your role. Gathering, preparing and analyzing is important but the final step in this process is equally important and that task often frustrates the user more than anything. Excel, cross-tab and tabular reporting are helpful, but those report and documentation options typically present data in columns and rows. A BI reporting tool that enables users to customize their view and approach and is easy to understand and use will make the user more productive and ensure Return on Investment (ROI).

Consider a Business Intelligence reporting tool that enables report, template and document design and configuration and supports preprinted fixed formats too. IT team members or consultants can leverage a simple, basic programming or scripting environment to define format templates and use data from Datasets and objects to produce stunning pixel perfect reports. Users can preview reports, export data to PDF files and share documents and reports via email at predefined frequency using delivery and publishing agents.

Benefits of Agile, Flexible Business Intelligence Reporting

  • Customize and Format Reports, Documents, Forms and Templates Using Basic Scripting Skills
  • Generate Reports from BI Datasets in Predefined Formats
  • Satisfy Unique Business, Departmental, Functional and Statutory Requirements
  • Present Information in a Clean, Attractive Format for Customers, Partners, Suppliers, Team Members
  • Allows Business Users to Gather, Present and Share Information via Email and Publishing Agent

‘If you are considering a Business Intelligence or Augmented Analytics solution, be sure to select a software suite that provides your business users with personalized dashboards, multidimensional key performance indicators, and KPI tools, report software, Crosstab and Tabular reports, GeoMaps and deep dive analytics.’

For out-of-the-box reporting and flexible, interactive formats, explore our full suite of reporting tools: Pixel Perfect Print ReportsBusiness Intelligence Reporting. If your organization is looking for BI Tools and Augmented Analytics that leverage advanced techniques to keep pace with changing enterprise needs and support business agility, let us help you realize your business goals and objectives with fact-based information, and flexible, scalable technology solutions that will support Citizen Data Scientist initiatives, and improved data literacy and data democratization.

Original Post : BI Reporting Tools Can Make or Break Decision-Making!

Mobile Business Intelligence is Your Secret Weapon!

Give Business Users Mobile BI to Extend the Office and Improve Responsiveness!

Change is ever-present, and no more so than in the past three or four years. As COVID has changed the way people work, and the location in which they do their work, the need for mobile BI Tools has grown exponentially. Neither the organization, nor the business users can afford to delay the use of business intelligence tools until they are in the office. Every business must do more with less.

‘Mobile BI should provide data analytics access for all business users and, above all, provide flexible, agile solutions that can be used at all levels to collaborate, share data and report and communicate with clarity.’

Mobile BI tools can provide support for team members as they travel, as they work from home, and as they collaborate with other team members from a client office, an airport, a train station, or a supplier location.

According to recent studies, the single most important benefit of Mobile Business Intelligence is enhanced data visibility. Another way to look at it is to consider the lost opportunities and the many missteps the organization will experience if it cannot make sense of its data in real time and with a comprehensive view into the data it captures across the enterprise.

Enable User Adoption with Self-Serve BI and Cross-Tab Analytics

Don’t try to dictate the type of device, the size of the screen or the resolution. Be sure you choose a mobile BI solution that will satisfy all manner of devices. Choose a user interface (UI) that is responsive and adaptive – one that provides self-serve tools without redesign or restructuring of dashboards for specific devices or screens. You can enhance total cost of ownership (TCO) and improve return on investment (ROI) with tools that are flexible and can be easily used in any environment.

Empower your users with integrated business intelligence tools that provide access to data in an interactive, personalized view and enable data sharing, identification of trends and patterns and user empowerment and accountability. Out-of-the-box mobile BI tools should support your users with tools that make it easier to understand data analytics and use data for reporting, presentation and collaboration with personalized dashboards and reporting and flexible graphs and charts.

‘Be sure you choose a mobile BI solution that will satisfy all manner of devices.’

The right mobile business intelligence solution should allow your users to get started right away without extensive training and at a reasonable cost. It should enable integration of data across disparate data sources so users have access to all the data they need to get a complete and comprehensive picture of business results, the root cause of problems and the opportunities that will provide unique competitive advantage to the organization.

Comprehensive BI Tools and Mobile BI should provide data analytics access for all business users and, above all, provide flexible, agile solutions that can be used at all levels to collaborate, share data and report and communicate with clarity. Simple, Self-Serve BI Tools can provide your business with the foundation to achieve your data democratization and user adoption goals. Let us help you achieve your vision and improve productivity and insight across the organization.

Original Post : Mobile BI Expands the Reach and the Benefits of BI Tools!

3 Ways Cross-Tab BI Can Improve Reporting!

By some estimates, a business will experience a three-month lag between the time a report is produced and the point at which the enterprise sees improvement or results from the changes the report recommends or predicts. If the reporting is unclear or unconvincing, the recommendations may never be implemented and the report will sit in a file on someone’s computer.

Prepare for Success with the Right BI Tools!

4 Things to Know to Prepare for BI Tools and Data Democratization!

The days of data silos and exclusive data access are over. Data Scientists and business analysts are still an important component of the business and IT teams are still crucial to the success and stability of the organization BUT if you are thinking that these roles are still responsible for day-to-day analytics and delivering every bit of data analysis to the enterprise, your business strategy needs an upgrade!

Leverage Key Performance Indicators to Achieve Results!

Key Performance Indicators and Performance Management are Crucial to Business Agility!

When a business takes on the task of going from an opinion-based, guessing game environment to a metrics-based, fact-based environment, it must decide WHAT to measure. Metrics are fine, but deciding what is important to measure is crucial. You can measure the wrong things and end up knowing nothing about what is happening in your enterprise, and which tasks and activities are contributing to your bottom line, as opposed to the tasks that are non-productive and business processes that should be modified.

Employ BI Tools and Augmented Analytics for Business Users!

Business Intelligence and Augmented Analytics Go Hand in Hand!

Business Intelligence is mandatory! Without intelligence you have no insight into your customer buying behavior, your competition or your organization. In order to achieve business intelligence in today’s environment, you need modern BI tools and augmented analytics that is suitable for your business users.