Understanding How Businesses Use Mobile BI to Achieve Results!

Mobile BI Business Use Illustrates Real Advantages!

Mobile Business Intelligence (or Mobile BI) is defined as ‘a system comprising both technical and organizational elements that present historical and/or real-time information to its users for analysis on mobile devices such as smartphones and tablets (not laptops), to enable effective decision-making and management support, for the overall purpose of increasing firm performance.’

Aberdeen Group reports that businesses adopt Mobile BI to:

  • Improve business process efficiency
  • Improve employee productivity
  • Make better decisions, more quickly
  • Provide better customer service
  • Deliver real-time bi-directional data access to make decisions anytime and anywhere.

‘Mobile BI benefits go well beyond simple reporting and the sharing of data across user groups, to address real business issues and to keep users up to date and allow them to respond to real world, real-time issues.’

As local and global competition increases, most businesses are looking for ways to improve their competitive advantage, and to quickly adapt to the changing market, to employee needs and to customer buying behavior.

It can be helpful to consider some real-world business use cases, in order to understand the value and benefit of incorporating a Mobile BI solution within your technology landscape and your analytics approach.

The advantages of Mobile BI go beyond team collaboration and individual reporting needs, to provide the background and foundational information needed to make decisions on business strategy and to understand customer preferences.

Real World Business Use of Mobile BI Reveals Benefits and Advantages

The following list of companies represents a small sampling of businesses currently using Mobile BI to improve business results and efficiency:

Amazon – Amazon analyzes purchasing behavior and browsing history to predict what products a customer might want to see, and what they are likely to buy, personalizing the customer experience and making it easier for customers to complete a transaction. BI tools help the business to forecast demand and ensure that stock is available.

Starbucks – The business has implemented a loyalty program to help with customer engagement and sales, personalizing marketing strategies and allowing customers to order, pay and receive rewards. It gathers data using its digital channels and uses that data to create targeted offers and to improve customer retention, as well as increasing the amount customers spend during a visit.

Netflix – The company uses BI tools to personalize the viewing experience and to analyze customer viewing preferences and push specific options to the customer based on viewing history. Mobile BI tools allow teams to analyze and share information regarding regional viewing and to make decisions on the fly.

Uber – The company business model is dependent on the rapid changes and shifting behavior of customers from one local and regional area to the next. Real-time pricing and operational decisions are made to support surge pricing and driver deployment for high demand areas. The back-end systems and BI tools allow drivers to access information using the Uber app so that they can quickly respond to the changing environment.

Tesla – Mobile BI and wireless car data analytics allow Tesla to connect remotely to corporate offices and collect and analyze vehicle data to address issues and update customers on maintenance etc.

X/Twitter – Mobile BI provides support or moderators to identify and quickly address platform safety issues, violations, etc. The integration of artificial intelligence (AI) with BI tools allows the business to quickly respond and ensure a safe user experience.

Mobile BI provides the background and foundational information needed to make decisions on business strategy and to understand customer preferences.

These examples illustrate the many ways in which Mobile BI can be used to address business issues, providing user access and analytics for team members no matter where they are and how they need to use the data. Mobile BI benefits go well beyond simple reporting and the sharing of data across user groups, to address real business issues and to keep users up to date and allow them to respond to real world, real-time issues.

If you want to support your business user team and provide a foundation for BI tools that will better serve your team and your customers, explore Smarten Mobile BI benefits and features,  with powerful functionality and access for your business users including out-of-the-box Mobile BI and advanced analytics for every team member. For more information on Mobile BI and Augmented Analytics, read our article, ‘Understanding The Truth About Mobile BI.’

Original Post : Understanding How Businesses Use Mobile BI to Achieve Results!

Choose the Right Mobile BI Solution for Your Business!

What Do I Need to Know Before I Choose a Mobile Business Intelligence (BI) Solution for My Business?

What makes a great Mobile Business Intelligence (BI) solution? There are many factors to consider and, if you do not choose wisely, you risk a) spending a lot of money and getting very little in return, b) working with incorrect, old or incomplete data, c) having to upgrade and spend even more money, d) disappointing your team and falling short of objectives, e) missing your Citizen Data Scientist initiative goals.

Use Smart Data Visualization to Improve Decisions!

Smart Data Visualization and Personalized Dashboards Improve Data Insight and Team Collaboration!

Augmented Analytics was designed to remove the barriers erected by the traditional business intelligence and analytics solutions. In order to achieve data democratization and improve data literacy among team members within an enterprise, the organization must provide simple, easy-to-understand solutions that display analytical results in a way that is meaningful and intuitive.

Mobile BI Improves Productivity and Results!

Add Mobile BI for Your Team and Improve Access, Analytics and Business Decisions!

Recent surveys reveal that the mobile BI market is growing by leaps and bounds. Of those surveyed, over 35% of companies said that mobile BI is in use among their business users. While some businesses have yet to adopt BI tools or augmented analytics for their business users, many have done so, and are now in the process of adding mobile BI to the set of tools available to users. There is no doubt that the COVID pandemic affected this strategy, since many businesses are now embracing a full-time or a hybrid remote work environment that requires team members to have access to tools from wherever they are working.

Mobile BI Tools for Citizen Data Scientists!

Mobile BI Tools Support Citizen Data Scientists and All Team Members With Access to Critical Data!

When a business takes on a Citizen Data Scientist initiative, it must provide the tools and techniques the business user will need to support the new role. Augmented Analytics is key – with features and tools that make it easy to integrate, find, analyze and share data across the enterprise.

Gartner has predicted that, ‘90% of corporate strategies will explicitly mention information as a critical enterprise asset and analytics as an essential competency.’

If your organization is doing it right, the Citizen Data Scientist initiative will incorporate support to change the culture, to update the employee evaluation process to encourage the use of analytics and fact-based decision-making, and other factors that influence user adoption and enable the business to move forward with a team alignment.

But one thing many businesses fail to consider is the need for these tools outside the walls of the office environment. If the global pandemic taught us anything is that many employees were forced to work at home or in settings outside the typical office facility. Today, many companies have embraced this concept on a long-term basis, allowing their employees to work from home, or in remote group locations. But even if your business is situated in one more office buildings or store fronts, the chances are good that your team members spend a certain amount of time working outside the office, after hours, on weekends, etc.

‘Mobile BI tools provide the support for your Citizen Data Scientists, data scientists, business analysts, team members, executives, and managers so that every business user can access and analyze data, share, and collaborate.’

Teams today are asked to do more with less and, as work hours expand, and the expectations of businesses change, the team must adapt. Managers, executives, IT teams and others find themselves in situations where they must check the status of a project, approve a purchase or resource acquisition, communicate with a team and assess the need to make changes – the list goes on and on!

Mobile BI Supports Citizen Data Scientists and Data Literacy

Mobile BI tools provide the support for your Citizen Data Scientists, data scientists, business analysts, team members, executives, and managers so that every business user can access and analyze data, share, and collaborate and make decisions on the fly, in a staff meeting, in an airport or hotel, or at home.

To ensure that you choose the right tools for your Citizen Data Scientists, look for a Mobile Business Intelligence solution that offers the following features and functionality:

  • Native app, with seamless user interface for a great user experience (Ux). Available for iOS and Android
  • Extends the office environment. Allows swift analysis and decisions from anywhere
  • Encourages user adoption and provides support for BI investments and data democratization
  • Access rights are defined on the server so security and privacy is ensured at all levels
  • Hosted anywhere within IT infrastructure – on premises, public or private cloud
  • Business Users have access to dashboards, reports, Clickless Analytics – Google-type Natural Language Processing (NLP) Search functionality
  • Start-up is easy, within a few minutes and support is readily available

‘One thing many businesses fail to consider is the need for BI tools outside the walls of the office environment.’

If you want to support your Citizen Data Scientists and every member of your business user team, explore Smarten Mobile Augmented Analytics And Mobile BI. Add powerful functionality and access for your business users with out-of-the-box Mobile BI and advanced analytics for every team member. For more information on Mobile BI and Augmented Analytics, read our article, ‘Understanding The Truth About Mobile BI.’

Original Post : Mobile BI Supports Citizen Data Scientists and Data Literacy!

Self-Serve Cross-Tab BI Tools Reveal Issues and Possibilities!

Self-Serve BI Tools with Cross-Tab Reporting Improve Clarity and Results!

If you are considering a Business Intelligence solution or BI tool, or if you wish to upgrade your business intelligence and reporting tools, look for a solution that has self-serve cross tabulation, or cross-tab reporting. Cross-Tab reporting reveals the relationship between two factors or targets. This analytical tool can be used for side-by-side comparisons and to compare results for one or more data points, variables, or targets.

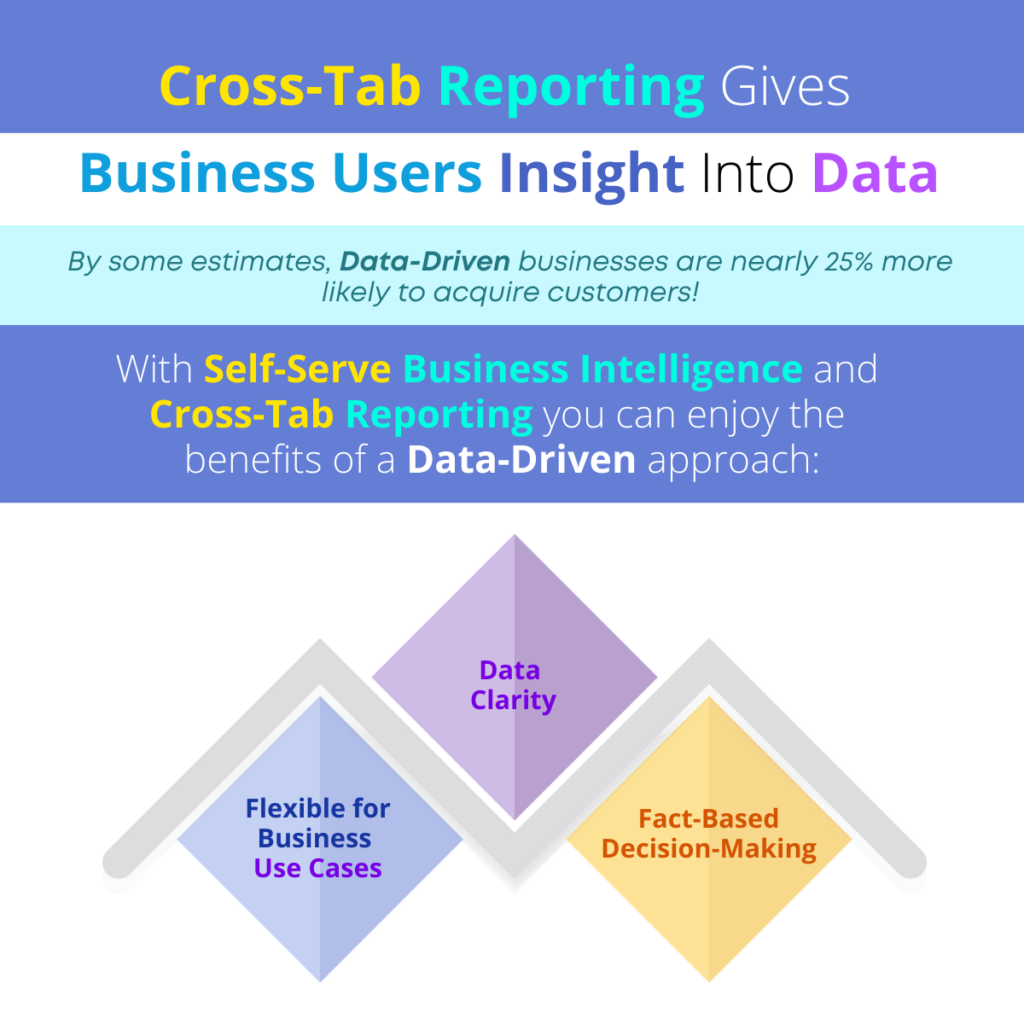
Did you know that, by some estimates, data-driven businesses are nearly 25% more likely to acquire customers? If you can give your team easy-to-use BI tools with self-serve cross-tab reporting, you can put the power of market and customer knowledge in their hands!

‘Business Intelligence solutions with self-serve cross-tab reporting can provide an intuitive, clear method of data analysis for your business users by revealing relationships in a way that makes the results clear and helps the organization to make the best decisions.’

In this article, we discuss the value of self-serve BI tools with Cross-Tab capabilities and the benefits of this type of focus and insight.

Cross-Tab Reporting Gives Business Users Insight Into Data

Benefits of Self-Serve Cross Tabulation Reporting

Flexible for Business Use Cases

Cross-tab reporting allows for intuitive use by business users with average technical skills, and can be beneficial for all types of business functions and industries. In an educational setting, a university or school might use cross-tab reporting to analyze teacher or course evaluations, looking at the relationship between student satisfaction and the subject, the class time, class location and other factors. Businesses can analyze team and employee satisfaction and attrition by looking at job location, benefits, the results of exit interviews, available training, and support, etc. Cross-tab reporting is frequently used in market research to analyze the various factors that relate to product or service satisfaction, including product features and options, where and how the product is sold, the sales and marketing approach, etc. A retail store owner might use cross-tab data analysis to determine customer satisfaction by looking at demographics, the gender of the person buying the product, the price of the product in a particular region, etc.

Data Clarity

There are many ways to slice and dice data and many ways in which crucial information can hide inside that data. The self-serve cross-tab reporting approach allows business users to examine relationships among data points and factors, with more clarity and accuracy. This type of analysis provides more clarity and reveals results, interdependent relationships and factors that might otherwise be missed. Users can avoid confusion when working with data and analyze large datasets to reveal frequencies and percentages. With this information, the business can understand the ‘what if’ of the various factors and see how results would change if one factor or relationship is changed.

Fact-Based Decision-Making

Self-serve cross-tab reporting simplifies analytics and allows business users to spot trends and patterns and collaborate with other team members to adapt tasks and activities to resolve issues and/or capitalize on opportunities. Using cross tabulation reporting to understand the connection and relationship between two or more factors allows the business to make a decision, with confidence. Rather than guessing the reason for declining results, increased employee attrition or other problems, the enterprise can clearly see what factors (and the relationships among factors) are the cause of a problem and how to change those factors to get better results.

‘If you can give your team easy-to-use BI tools with self-serve cross-tab reporting, you can put the power of market and customer knowledge in their hands!’

Business Intelligence solutions with self-serve cross-tab reporting can provide an intuitive, clear method of data analysis for your business users by revealing relationships in a way that makes the results clear and helps the organization to make the best decisions. By giving your team members these tools, you can leverage domain and industry knowledge and combine data analytics in a day-to-day environment without the need for assistance from data scientists or the IT staff. Self-Serve Cross-Tab reporting produces clear results that are easy to understand and can be used in staff meetings and presentations to support recommendations and help the business become more agile.

Look for seamless Business Intelligence Reporting And Flexible Tools that include self-serve Cross-Tab reporting. Provide business intelligence that your IT team can easily implement and support, and a solution that business users will want to adopt. Choose  flexible, agile business intelligence solutions that can be used at all levels to collaborate, share data, and report and communicate with clarity. Self-Serve BI Tools can provide your business with the foundation to achieve your data democratization and user adoption goals.

Original Post : Cross-Tab Reporting Gives Business Users Insight Into Data!

Business Users Love Simple (Yet Sophisticated) BI Tools!

If You Want Business Users to Embrace BI Tools, You Need to Focus on Simplicity!

If your enterprise has not already adopted business intelligence tools, it is missing a crucial benefit in competitive positioning and accurate, dependable decision-making. If your organization has implemented BI tools, but you are falling short on user adoption success, return on investment (ROI) and total cost of ownership (TCO), it is probably because the business intelligence solution is not meant to support business users.

PC Magazine says that, as business users are asked to leverage BI tools, the enterprise must focus on simplicity to engender user adoption.

‘When your team can access BI tools that support the way they work and provide meaningful views and features to easily integrate with work and business processes, user adoption is easier and more immediate.’

To achieve your enterprise goals, ensure user adoption and get the most out of your investment, you must focus on two things: user-friendly features and function and sophisticated analytics.

BI Tool User Adoption Depends on Simplicity!

In this article, we list some of the considerations for business intelligence solution selection or product upgrade. This list is meant to help you assess your current solution, and/or review the capabilities of any BI tool you are considering.

Simplicity in Technology:

  • 100% browser-based solution
  • Intuitive interface
  • Mobile application that is suitable for iOS and Android
  • Simple, affordable licensing
  • Rapid implementation (roll out in minutes, not months)
  • Simple, multi-layered access and user rights management
  • Simple architecture

Simplicity of Use:

  • Ability to personalize dashboards
  • KPI Reporting
  • Easy-to-use reporting tools
  • Collaborative features
  • Social BI for sharing, ranking and commenting
  • Smart Data Visualization
  • Assisted Predictive Modeling
  • Self-Serve Data Preparation
  • Clickless analytics for easy searching and results

The business intelligence tools you select can and should include out-of-the-box, ready-to-use features that are designed to support your applications, your industry, and/or your business function. When your team can access BI tools that support the way they work and provide meaningful views and features to easily integrate with work and business processes, user adoption is easier and more immediate.

‘To achieve your enterprise goals, ensure user adoption and get the most out of your investment, you must focus on two things: user-friendly features and function and sophisticated analytics.’

Look for Ready-To-Use Tools that users will want to adopt. Provide business intelligence that your IT team can easily implement and support, with features your users will readily leverage. Choose  flexible, agile business intelligence solutions that can be used at all levels to collaborate, share data, and report and communicate with clarity. Self-Serve BI Tools can provide your business with the foundation to achieve your data democratization and user adoption goals.

Original Post : BI Tool User Adoption Depends on Simplicity!

Mobile Business Intelligence is Your Secret Weapon!

Give Business Users Mobile BI to Extend the Office and Improve Responsiveness!

Change is ever-present, and no more so than in the past three or four years. As COVID has changed the way people work, and the location in which they do their work, the need for mobile BI Tools has grown exponentially. Neither the organization, nor the business users can afford to delay the use of business intelligence tools until they are in the office. Every business must do more with less.

‘Mobile BI should provide data analytics access for all business users and, above all, provide flexible, agile solutions that can be used at all levels to collaborate, share data and report and communicate with clarity.’

Mobile BI tools can provide support for team members as they travel, as they work from home, and as they collaborate with other team members from a client office, an airport, a train station, or a supplier location.

According to recent studies, the single most important benefit of Mobile Business Intelligence is enhanced data visibility. Another way to look at it is to consider the lost opportunities and the many missteps the organization will experience if it cannot make sense of its data in real time and with a comprehensive view into the data it captures across the enterprise.

Enable User Adoption with Self-Serve BI and Cross-Tab Analytics

Don’t try to dictate the type of device, the size of the screen or the resolution. Be sure you choose a mobile BI solution that will satisfy all manner of devices. Choose a user interface (UI) that is responsive and adaptive – one that provides self-serve tools without redesign or restructuring of dashboards for specific devices or screens. You can enhance total cost of ownership (TCO) and improve return on investment (ROI) with tools that are flexible and can be easily used in any environment.

Empower your users with integrated business intelligence tools that provide access to data in an interactive, personalized view and enable data sharing, identification of trends and patterns and user empowerment and accountability. Out-of-the-box mobile BI tools should support your users with tools that make it easier to understand data analytics and use data for reporting, presentation and collaboration with personalized dashboards and reporting and flexible graphs and charts.

‘Be sure you choose a mobile BI solution that will satisfy all manner of devices.’

The right mobile business intelligence solution should allow your users to get started right away without extensive training and at a reasonable cost. It should enable integration of data across disparate data sources so users have access to all the data they need to get a complete and comprehensive picture of business results, the root cause of problems and the opportunities that will provide unique competitive advantage to the organization.

Comprehensive BI Tools and Mobile BI should provide data analytics access for all business users and, above all, provide flexible, agile solutions that can be used at all levels to collaborate, share data and report and communicate with clarity. Simple, Self-Serve BI Tools can provide your business with the foundation to achieve your data democratization and user adoption goals. Let us help you achieve your vision and improve productivity and insight across the organization.

Original Post : Mobile BI Expands the Reach and the Benefits of BI Tools!

KPIs and BI Dashboards Must Be Interactive!

Key Performance Indicators and BI Tools to Support Your Business with Dynamic, Interactive Features!

There is no room in today’s business world for speculation or guesswork! Whether you are presenting to your Board of Directors, making a recommendation to your management team, or pitching a new product or idea, objective, provable results and information are required. In order to succeed in business, team members must have access to tools that allow them to establish and monitor key performance indicators (KPIs) with measurable results so that the business can adapt to change, alter and adjust activities and tasks that do not provide successful outcomes, and build on success using models that have historically proven to achieve results.

‘Take the time to select a business intelligence solution that will advance your business interests and provide clear insight and help you to measure results.’

According to recent research, businesses use one of the following methods to capture and measure key performance indicators (KPIs): Spreadsheets, Dashboards and Reporting Tools, BI and Analytical Software.

In fact, the option that is likely to provide the most success is one that will eliminate human error in data entry and calculation of formulae and metrics. That would seem to suggest that a BI and Analytical software tool is the best way to establish and manage KPIs. But the sheer volume and complexity of enterprise data, distributed across the organization can be overwhelming.

BI Tools Should Have Multidimensional KPIs & Slice and Dice

Here are some important considerations for your business that will help you to choose the right BI tools and KPI features:

  • By gathering and integrating data from disparate systems and selecting a business intelligence solution that incorporates augmented analytics suitable for business users, the business can create a foundation upon which to build its success.
  • When selecting a BI tool, be sure to look at the capabilities provided for managing key performance indicators. With the right approach, the enterprise can achieve measurable and clear insight into key business objectives, so you can set goals, develop strategies to achieve these goals and objectively evaluate your performance and progress.
  • Look for business intelligence software that allows business users with average technology skills to define KPIs using an easy-to-use, powerful expression engine and to set polarity, frequency and threshold levels using a browser-based interface.
  • Avoid static reporting that will frustrate business users and instead give them interactive tools that are dynamic and will allow them to explore, slice and dice and get to the heart of the matter. KPIs should not be limited to static monitoring.
  • Choose KPI Analytics that provide interactive options to change frequencies, dimension break downs and drill down to further analyze trends, and reasons for performance and non-performance.
  • Remember that KPI tools are designed to be used. If you want your users to adopt these tools and use them on a daily basis, you will need an easy way to measure results and to make adjustments to workflow, processes and activities and adjust KPIs as appropriate. This method of continuous monitoring and management ensures that users can resolve issues and capitalize on opportunities as they arise.

‘A BI and Analytical software tool is the best way to establish and manage KPIs.’

Your business management team understands the need for clear, objective metrics. Be sure you take the time to select a business intelligence solution that will advance your business interests and provide clear insight and help you to measure results, adapt to the changing market and create an environment of continuous improvement.

BI tools with Multidimensional Key Performance Indicator (KPIs) features should provide data analytics access for all business users. Simple, self-serve BI tools can provide your business with the foundation to achieve your goals. Let us help you achieve your vision and improve productivity and insight across the organization.

Original Post : BI Tools Should Have Multidimensional KPIs & Slice and Dice!

Use a BI Tool with Cross-Tab Deep Dive Features!

Why It’s Important to Include Cross-Tab Deep Dive in Self-Serve BI Tools!

When a business decides to implement a self-serve business intelligence (BI solution, it must ensure that the tools really are ‘self-serve’ and that they provide the flexibility and agility to give power users the ability to create and analyze, and business users with average technology skills the ability to quickly and easily understand the augmented analytics tools they now have access to, and to use those tools to the benefits of the team and the organization.