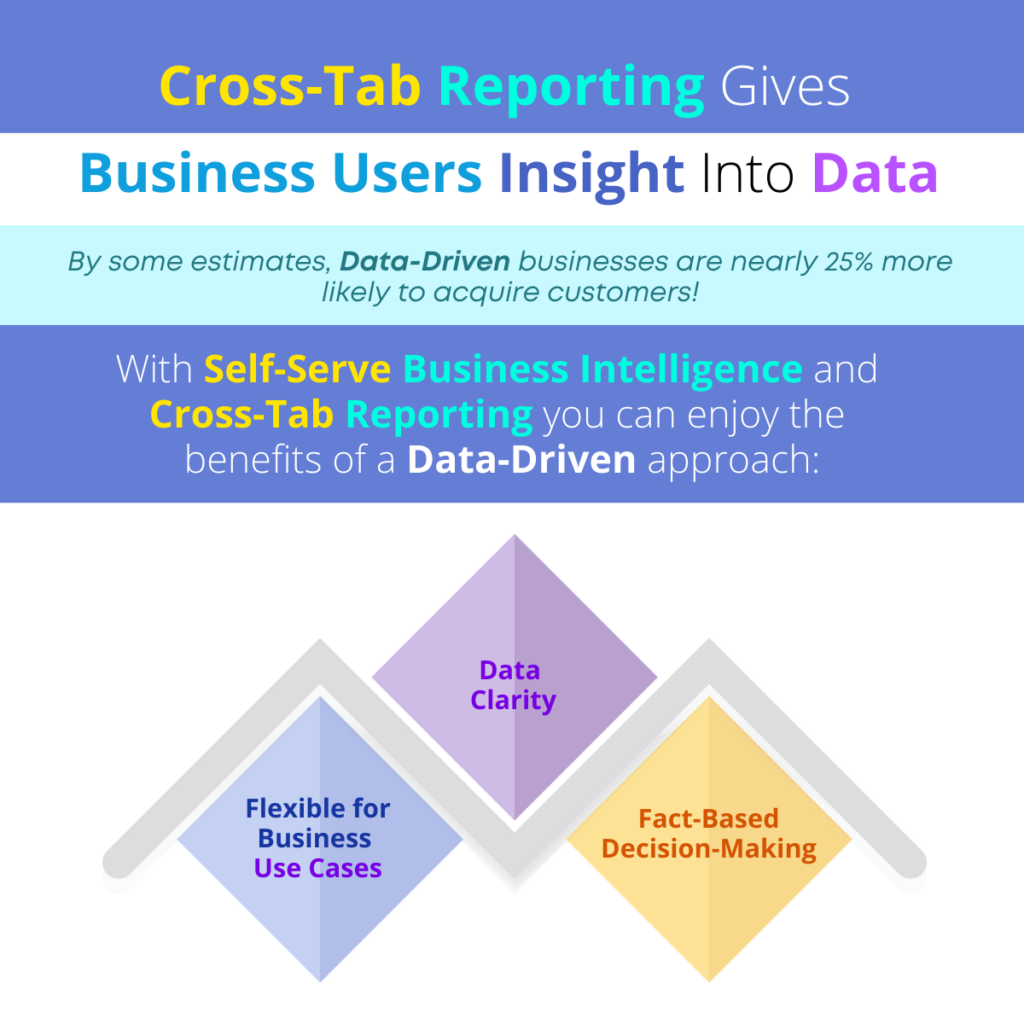
Users Love Self-Serve BI and Cross-Tab Analytics!

Ensure Business Users Will Adopt BI Tools with Self-Serve BI and Cross-Tab Analytics!

Gartner has predicted that, ‘90% of corporate strategies will explicitly mention information as a critical enterprise asset and analytics as an essential competency.’ Establishing the strategy is one thing, but getting business users to adopt an analytics and information-based business workflow is quite another.

‘Modern business intelligence tools that are designed with self-serve features makes it easy enough for every user (no matter their technical skill) to leverage analytics to report, share and collaborate.’

When it comes to teams, there are two things that are always true: 1) they learn a process and workflow and rarely want to change that familiar process and 2) they are always suspicious of ‘new’ initiatives and nearly always believe that these new initiatives will result in more work for them. There is a reason your team resists new processes and initiatives and that reason is simple. Usually, their fears are warranted!

So, if you want to engender support for new analytics initiatives and engage a business community in fact-based, action-oriented initiatives, you need to plan this new initiative with your users in mind.

In this article, we focus on two of the primary components of a new business user analytics initiative.

Enable User Adoption with Self-Serve BI and Cross-Tab Analytics

Self-Serve BI Tools

Modern business intelligence tools that are designed with self-serve features like smart data visualization, self-serve data preparation and assisted predictive modeling make it easy enough for every user (no matter their technical skill) to leverage analytics to report, share and collaborate. By adding value to the user’s everyday tasks and reducing the rework and issues they will confront, you can encourage your users to adopt analytics initiatives.

  • Any promotion of analytics strategy must clearly illustrate business use cases and benefits of these tools.
  • Support a more productive, streamlined environment that will allow them to do more with less and get the job done quickly.
  • Ensure that business users can collaborate and share and grow their own expertise and visibility.
  • Provide measurable results and information to make recommendations and support those recommendations.

Cross-Tab Analytics Capabilities

Those self-serve tools should include reporting and graphical tools that are clear and concise. Business users don’t want tools that produce complex reports filled with columns and mind-numbing numbers that do not help them reach a decision or illustrate an issue. Cross-tab analytics have been around for some time but the new, improved versions of this capability provides real insight into data in a way that is clear for every user. Sophisticated functionality is underpinned with easy-to-use tools so users can analyze the relationship between or among two or more variables and summarize data in rows and columns making it easy to understand the relationships and intersection of the various types of data. Understanding relationships in data is crucial to identifying the root cause of a problem or to targeting an issue or identifying a business opportunity. Your team members can work with multi-dimensional data and perform ad-hoc queries to gain a clear view of performance, dive into your data, and find and understand the data they need quickly and intuitively. Cross-tab analysis simplifies complex data operations, summary operations, time series functions, filters and custom column expressions and enables business users with simple tools they can really use.

‘If you want to engender support for new analytics initiatives and engage a business community in fact-based, action-oriented initiatives, you need to plan this new initiative with your users in mind.’

Business Intelligence tools can improve your business results. If your business understands the challenges of implementing a business intelligence solution and adequately plans for implementation and user adoption, it can leverage the benefits of these tools and solutions and ensure success. Let us help you achieve your vision and improve productivity and insight across the organization.

Original Post : Enable User Adoption with Self-Serve BI and Cross-Tab Analytics!

Can Democratizing BI Use Help My Team?

Why is Business Intelligence Democratization Important for My Business?

Gartner research reveals that, ‘80% of organizations seeking to scale digital business will fail because they do not take a modern approach to data and analytics governance.’

If you are considering democratizing business intelligence gathering and analytics, you are not alone! Businesses today face more competition from local and global markets and every team member must work quickly and accurately in support of goals and objectives if the enterprise is to achieve its goals.

‘When senior executives and managers have reliable information and dependable recommendations and suggestions, they can improve performance and accuracy in forecasting, planning and demand.’

In this article, we discuss a few of the reasons a business should consider democratizing business intelligence and analytics within its team and how this type of initiative can be implemented to help your enterprise succeed.

Should I Democratize Business Intelligence in My Business?

Working Smarter

When you provide BI tools to your business users, you democratize data and begin to build a better understanding of the root cause of problems, the opportunities the business can leverage and the way forward to solving problems and creating business success. Team members can work smarter, with quick, concise access, and insight into data via self-serve solutions that streamline and simplify the typically complex analytical process and allow every team member to perform the analysis and, more importantly, to understand what the results are telling them.

Focusing on Core Responsibilities

When you democratize business intelligence and analytics with augmented analytics tools, IT team members, data scientists and business analysts can focus on strategic goals and on initiatives where data must be 100% accurate. Team members can use BI tools on a daily basis to test theories and gather and analyze information to support activities and tasks, collaborate with others and move forward, so EVERYONE can focus on their own roles and core responsibilities.

Supporting the Greater Good

When senior executives and managers have reliable information and dependable recommendations and suggestions, they can improve performance and accuracy in forecasting, planning and demand. Team leaders, business unit managers and others can realize long-term benefits and count on the fact that all team members are working with the right information, that information and analysis is based on current, integrated data and on measurable results. The organization can shift to a results-based environment where problems are analyzed and resolved and opportunities are leveraged to the greatest extent possible, so the enterprise can create an environment of continuous improvement.

Creating a Common Language

When all team members are using business intelligence to test theories and hypothesize, to solve problems and get to the root of a problem, to identify those all-important ‘nuggets’ of information that make a competitive difference, managers and executives can feel confident that the team is speaking a common language and that every team members knows how to find a problem, how to explain that problem and how to dependable recommendations to solve that problem.

‘Businesses should consider democratizing business intelligence and analytics within teams to help the enterprise succeed.’

Business Intelligence tools can support data democratization and improve your business results. If your business understands the challenges of implementing a business intelligence solution and adequately plans for implementation and user adoption, it can leverage the benefits of these tools and solutions and ensure success. Let us help you achieve your vision and improve productivity and insight across the organization.

Original Post : Should I Democratize Business Intelligence in My Business?

BI Tools Provide Benefits and Challenges!

Understand the Benefits and the Challenges of a Business Intelligence Strategy!

If you follow industry and business publications, you know that analytics are taking the lead in business strategy. Gartner states that, ‘90% of corporate strategies will explicitly mention information as a critical enterprise asset and analytics as an essential competency.’ If your enterprise is implementing a business intelligence and analytics strategy, it is important to plan carefully and to understand the real benefits as well as the challenges of choosing the right BI tools and deploying these tools to users in a way that will ensure optimal user adoption and leverage of analytics to achieve the results you need.

‘Your business should carefully assess requirements and plan for expected user adoption by selecting a BI tool that will offer the features, ease-of-use and functionality your team members need.’

In this article, we provide examples of the various benefits of BI tools for specific business functions and some of the technology and user challenges you will face as you consider your options and plan for implementation.

Address the Challenges and Achieve the Benefits of BI Tools

No matter the business function, there are benefits to implementing a business intelligence strategy that will deploy these tools to your team members. Here are some examples:

Benefits

Finance – Your organization will be more efficient and profitable, with Ready-to-Use Dashboards, Analysis, and KPIs designed especially for the Finance domain. This business intelligence solution includes interactive Dashboards that allow users to perform intuitive, easy analysis of key metrics including Profitability, Accounts Receivable, Accounts Payables, Cash Flow Analysis, Past Due Invoices, Balance Sheets, Income Statements and more!

Inventory – Inventory business function allows users to accurately plan and optimize inventory. Interactive Dashboards track item movement, compare sales to closing stock, and monitor warehouse stock and value, and answer critical questions regarding stock turnover ratio, seasonal buying, back-order assessment and safety stock to prevent lost sales. Users can analyze inventory levels to effectively manage stock based on the buying behavior of customers.

Purchasing and Procurement – Allows users to view and analyze spending details, analyze procurement data, drill through data to analyze issues, measure performance, identify savings opportunities, and track supplier performance. Identify reliable trading partners, analyze supplier cost, perform purchase rate comparisons, reveal trends, identify top/bottom vendors, and achieve timely insight into spending patterns and trends across all departments.

Production – Quantify and visualize data at the operational level to make fact-based decisions. Analyze Output, Reduce Labor Costs, Maintain Inventory Levels, Optimize Equipment Performance, Monitor Rejection Ratios and Downtime, and take action before problems arise to mitigate risk, and capitalize on opportunities. Publish automated reports to monitor and manage plant performance and provide management with quality metrics and relevant data.

These are just a few examples of how business intelligence can be used within a business function, department or business unit to benefit business users and to help the organization make fact-based decisions, spot trends and patterns and opportunities, and identify the root cause of problems.

If you want to take advantage of all of these benefits and ensure success of your business intelligence initiative, your business should carefully assess requirements and plan for expected user adoption by selecting a BI tool that will offer the features, ease-of-use and functionality your team members need.

Technology and User Challenges

Social BI

Your team members are also consumers and outside of the office they are used to a collaborate and social experience. By engaging in Social BI, your team can champion data sharing, collaborate on creative ways to analyze data and make quick work of data analytics, with tools that allow the user to ‘like’, ‘share’ and leverage other social tools and networking techniques.

Mobile BI

Not every BI tool provides real mobile business intelligence to accommodate every type of device, screen size and resolution. Choose a solution that has a Responsive and Adaptive UI engine, so you can roll out BI tools on any Desktop, Tablet or Smartphone without any device specific development. ‘Design once, Use anywhere’ concept in true sense.

Personalized Dashboards

Business users will not adopt a solution that limits them to predefined dashboards. Each user has a need to see and use data in a different way. Be sure to select a solution that allows your users to work in a way that is meaningful to them.

Interactive, NOT Restrictive

Choose a solution that will allow users to leverage deep dive analytics. There is no way an organization can anticipate every question or type of analytics a business user will need to incorporate into decision-making. Provide truly interactive tools that will assure user adoption and make your organization more agile.

Ease-of-Use

Advanced Data Discovery allows business users to perform early prototyping and to test hypothesis without the skills of a data scientist. Advanced Data Discovery ensures data democratization with Self-Serve Data Preparation, Smart Data Visualization and Plug n’ Play Predictive analysis that can drastically reduce the time and cost of analysis and experimentation.

‘No matter the business function, there are benefits to implementing a business intelligence strategy that will deploy these tools to your team members.’

Ready-To-Use Business Intelligence tools can support data democratization and improve your business results. If your business understands the challenges of implementing a business intelligence solution and adequately plans for implementation and user adoption, it can leverage the benefits of these tools and solutions and ensure success. Let us help you achieve your vision and improve productivity and insight across the organization.

Original Post : Address the Challenges and Achieve the Benefits of BI Tools!

Understanding the Truth About Mobile BI!

Considering a Mobile BI App? Understand the WHAT of Mobile Augmented Analytics Before You Choose!

If your business is considering a Business Intelligence or BI tool or an augmented analytics tool for its business users, the addition of this type of tool can and will improve user adoption of analytics, data democratization and data literacy. As you consider your requirements, your user and technology needs and other factors, do not forget to add mobile BI tools and augmented analytics to your list of requirements. A BI Mobile App will further improve user adoption and fact-based decisions.

By some estimates the Mobile Business Intelligence Market is expected to achieve a Compound Annual Growth Rate (CAGR) of 22.43%

‘If a vendor or solution provides only SOME of the features and functionality business users require, the solution cannot truly be considered a Mobile BI app.’

In this article, we define Mobile BI and the concept of a Mobile Augmented Analytics App, so that your business can achieve a more complete picture of these tools.

What is True Mobile BI?

Perhaps the best place to start this discussion is to define what Mobile BI is NOT.

What Mobile BI and Mobile Analytics is NOT

A true Mobile BI and Augmented Analytics App should not be restrictive. Limited views and access will only frustrate users.

Real Mobile BI is not just a series of static reports or limited access to data that would otherwise be available from within the walls of the enterprise.

What IS Mobile BI and Augmented Analytics?

Mobile Augmented Analytics is based on a comprehensive advanced analytics solution with sophisticated features, analytical algorithms and functionality designed for business users with average technical skills.

Mobile BI is designed to extend the augmented analytics environment beyond the walls of the enterprise and support remote work, team members who travel and those who wish to work while on the road.

A Mobile BI and Augmented Analytics App accommodates both Android and iOS devices so that users can access features, reporting, data sharing etc., on the device of their choice.

Mobile BI for Business Users is easy to implement and license and does not require extensive training.

Mobile Augmented Analytics provides a functional environment for analytics, extending the features the user leverages within the office on a desktop so that the user can analyze data with full access into datasets, dashboards and reports.

Mobile BI apps must present data appropriately, no matter the size of the screen or the resolution. Navigation must be easy and intuitive.

If a vendor or solution provides only SOME of the features and functionality business users require, the solution cannot truly be considered a Mobile BI app. Implementing data democracy initiatives to support the transition from business user to Citizen Data Scientist requires tools that can be used in a real work environment and that must include true mobile access to a comprehensive set of features.

Remember, your team members are also consumers who are used to access to all their favorite apps no matter where they are, and no matter which type of device they choose to use.

‘A BI Mobile App will further improve user adoption and fact-based decisions.’

Explore Smarten Mobile Augmented Analytics And Mobile BI and add powerful functionality and access for your business users with out-of-the-box Mobile BI and advanced analytics for every team member in your enterprise. For more information on Mobile BI and Augmented Analytics, read our articles, ‘The Importance of Adding a Mobile BI App to an Augmented Analytics Strategy’, and ‘What Should My Business Consider When Selecting a Mobile BI Solution?

Original Post : What is True Mobile BI?

The Right Mobile BI App Can Produce Results!

Your Enterprise Can Leverage Mobile BI to Achieve User Adoption and Enterprise Results!

Gartner has predicted that ‘augmented analytics will be ubiquitous, but only 10% of users will use it to its full potential.’ Perhaps one of the most important aspects of user adoption is to provide the business intelligence tools at the place and time the user needs them. That means that a solution considered by the organization must be one that supports mobile devices.

‘The organization should look for a ‘design once, use anywhere’ approach that allows for maximum flexibility.’

In this article, we discuss how the organization can assess and choose the right Mobile BI solution to ensure optimal results and user adoption.

Choose the Right Mobile BI App and Get Results

Convenient Access for Users

The augmented analytics, business intelligence solution that offers out-of-the-box mobile access for all types of mobile devices, tablets and desktops allows users to perform analytics, collaborate and report on the road, in the office, in hotels – in short, anywhere. With mobile BI support, the enterprise can provide a self-serve BI tool that encourages user adoption and supports data democratization and analytics for all team members without expensive customization or restrictive dashboards or reports. The Mobile BI solution that supports all devices and screen sizes allows users to access analytics using any device they leverage for work-related activities.

Dependable Performance to Support Technology Infrastructure and Future Needs

The enterprise must assess its business intelligence needs and plan for the future but not every evolutionary path is predictable. So, a Mobile BI tool that supports current and future data and user volume is an imperative. The organization should look for a ‘design once, use anywhere’ approach that allows for maximum flexibility. As devices change and evolve and users, locations and data changes, the organization can meet its needs without additional licensing or developmental costs.

Integrated Mobile BI Tools

If the augmented analytics solution and BI tools are comprised of comprehensive features to allow for easy-to-use dashboards, reporting, and graphs, charts and key performance indicators (KPIs), those features must be designed to seamlessly display and function on any type of device, any screen and any resolution, so users are not frustrated and access is simple and intuitive.

‘Perhaps one of the most important aspects of user adoption is to provide the business intelligence tools at the place and time the user needs them.’

Find out how Mobile BI And Augmented Analytics can support data democratization and improve your business results. Let us help you achieve your vision and improve productivity and insight across the organization.

Original Post : Choose the Right Mobile BI App and Get Results!

Prepare for Success with the Right BI Tools!

4 Things to Know to Prepare for BI Tools and Data Democratization!

The days of data silos and exclusive data access are over. Data Scientists and business analysts are still an important component of the business and IT teams are still crucial to the success and stability of the organization BUT if you are thinking that these roles are still responsible for day-to-day analytics and delivering every bit of data analysis to the enterprise, your business strategy needs an upgrade!

Self-Serve BI and Augmented Analytics Has Many Rewards!

Address the Challenges and Enjoy the Benefits of Self-Serve BI Tools!

If you are a business manager, senior executive, IT professional or analytical professional, you are probably well aware of the emergence of business intelligence solutions, BI tools and augmented analytics for business users. In all likelihood, you have been hearing about these trends in annual conference and industry journals. If your business has not yet adopted such an initiative, it is likely to do so within the next year. But it might surprise you to know that, world renowned technology research firm, Gartner, predicts that ‘By 2022, augmented analytics will be ubiquitous, but only 10% of users will use it to its full potential.’ Given the focus and effort invested in business intelligence and augmented analytics, this prediction is disappointing, but understandable.

Mobile BI Improves User Adoption and ROI!

Here’s How Mobile BI Encourages User Adoption and TCO!

Businesses that invest in business intelligence solutions expect to achieve results, become more competitive and improve productivity, but these businesses often fail to understand the need for Mobile BI. Mobile business intelligence should provide all the features and search capability a user needs to perform tasks and get information while on the road, working remotely or visiting a client, partner or regional office.

Traditional & Modern BI and Analytics: A Perfect Combination Solutions!

Combine Traditional BI with Modern BI and Analytics to Improve User Adoption and Gain Advantage!

The world-renowned technology research firm, Gartner, predicts that, ‘through 2024, 50% of organizations will adopt modern data quality solutions to better support their digital business initiatives’. As businesses consider the options for data analytics, it is important to understand the impact of solution selection.

Case Study : Augmented Analytics OEM Partnership for U.S. Healthcare ERP Business

Augmented Analytics OEM Partnership for U.S. Healthcare ERP Business

Our Partner is a healthcare service provider in the United States providing a web-based, patient-centric, healthcare management solution and workflow solutions to increase operational efficiency and reduce costs for its hospitals and healthcare facility Clients. Since 1999, the Partner has provided services to the durable medical equipment and supply market with solutions that benefit many healthcare organizations and clinics in the U.S.

###