The Client is an India-based construction and infrastructure development company, committed to delivering quality infrastructure for private, public, and government projects. With over fifty (50) years of accumulated knowledge and experience, the organization applies its extensive resources to ensure superior infrastructure solutions.
Tag: BI Software
The Client is a state government with a population of approximately 30 million citizens, and an annual budget of $5 billion USD. This government agency focuses on implementing IT and e-governance initiatives to enhance citizen services and governance efficiency. By leveraging advanced technology, the agency aims to improve the quality of life for citizens and to streamline administrative processes across and throughout departments.
How Do We Define Business Intelligence Today?
Business Intelligence (BI) is the lifeblood of an organization. Without business intelligence, the enterprise does not have an objective understanding of what works, what does not work, and how, when and where to make changes to adapt to the market, its customers and its competition.
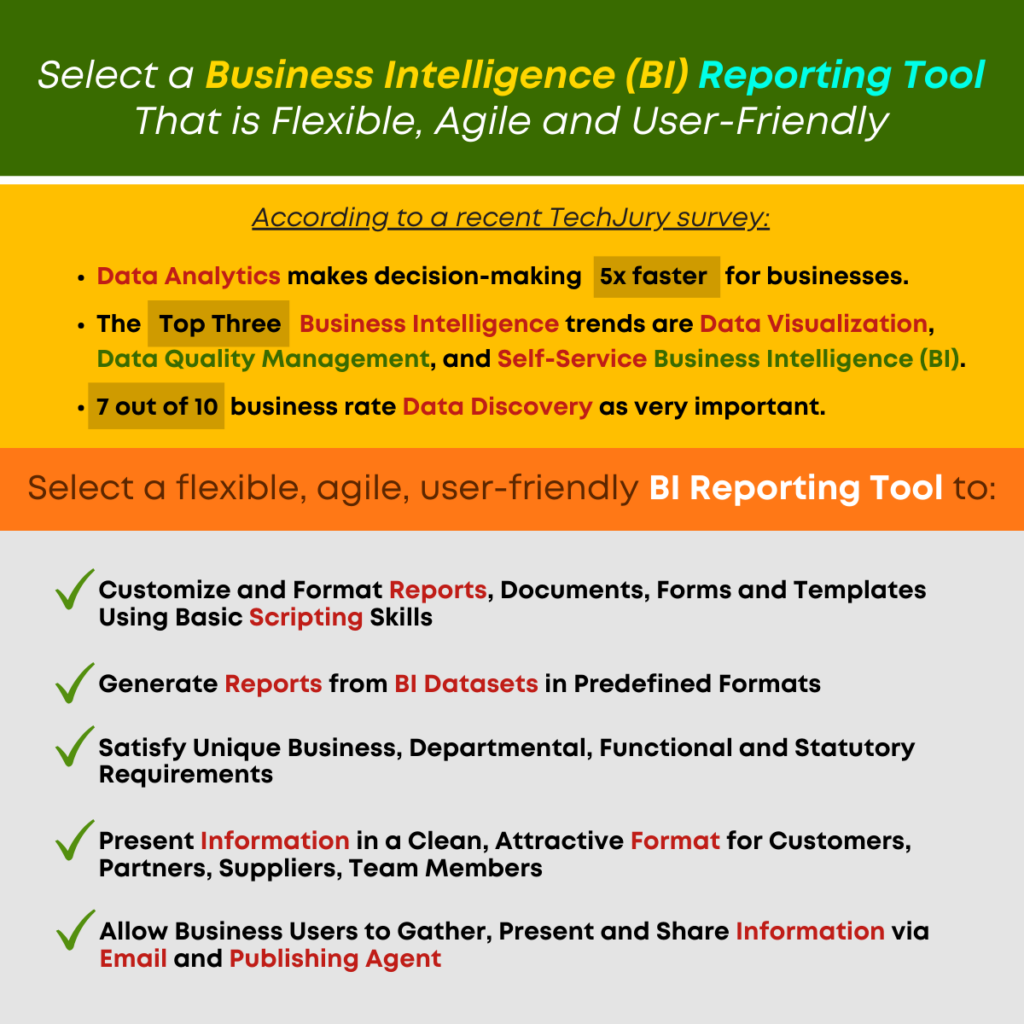
You may be interested to know that TechJury reports seven out of ten businesses rate data discovery as very important, and that the top three business intelligence trends are data visualization, data quality management and self-service business intelligence.
As the Business Intelligence solution market evolves, it may be difficult for an organization to know when to invest in these tools, and which tools are best for enterprise and user needs.
BI Tools with Self-Serve Multidimensional KPIs Enable Agility and Accuracy!
Gartner research reveals that, ‘data literacy will become an explicit and necessary driver of business value, demonstrated by its formal inclusion in over 80% of data and analytics strategies and change management programs.’ When businesses adopt and embrace business intelligence and augmented analytics, the expectation is that the enterprise will benefit by improving data literacy as well as productivity.
But if your business wants to make the most out of BI tools and augmented analytics, it is important to choose the right solution; one that is easy to use and will provide clear results – results business users can leverage to make decisions and to plan accurately. To understand the results and whether policies, processes and tasks are effective, your organization must establish metrics, and those metrics must also be clear.
‘Key Performance Indicators (KPIs) are crucial to this feature set, as they provide critical metrics that enable the business to discover and manage results objectively and to adapt and change quickly and effectively.’
A solution that provides easy-to-use, multidimensional key performance indicators (KPIs) will allow your team to establish metrics that are unique to your needs and to your industry and market and help the enterprise understand how the business measures up in the competitive market, how well the products and services are faring with customers and whether workflow and business processes are having the desired effect.
Benefits of Self-Serve, Multidimensional Key Performance Indicators (KPIs)
- When the organization gives business users the tools to establish and manage KPIs, it can become more productive. There is no waiting for the IT team or a data scientist to produce important reports, so the team can be agile and flexible.
- Interactive KPIs provide tools to gather, analyze and measure with breakdown and dynamic frequency and slice and dice so users can focus on critical metrics and gain true insight into results. Users can leverage a powerful expression engine to set polarity, frequency and threshold levels in a browser-based interface and go beyond static monitoring to change frequencies, and dimension breakdowns and gain an understanding of performance and issues.
- Users can establish and monitor KPIs at the individual, team, department, division, and company level and KPIs are integrated with other features to further analyze trends. Multidimensional KPIs gives business users the opportunity to monitor and manage results against goals and objectives and change processes, tasks, and activities as and when change is required.
‘When your business chooses a BI tool, it is important to choose the right solution; one that is easy to use and will provide clear results – results business users can leverage to make decisions and to plan accurately.’
If your business wishes to improve data literacy and productivity by implementing or upgrading a Business Intelligence or Augmented Analytics solution, it is imperative that you review the available modules, tools and features to ensure that the solution provides easy-to-use, sophisticated functionality that is suitable for your business users. Key Performance Indicators (KPIs) are crucial to this feature set, as they provide critical metrics that enable the business to discover and manage results objectively and to adapt and change quickly and effectively.
Choose a Business Intelligence Reporting Solution that include Multi-Dimensional Key Performance Indicators (KPIs). Provide business intelligence that your IT team can easily implement and support, and a solution that business users will want to adopt. Choose flexible, agile business intelligence solutions that can be used at all levels to collaborate, share data, and report and communicate with clarity. Self-Serve BI Tools can provide your business with the foundation to achieve your data democratization and user adoption goals.
Original Post : Multidimensional KPIs Provide Easy-to-Use, Objective Metrics!
Self-Serve BI Tools with Cross-Tab Reporting Improve Clarity and Results!
If you are considering a Business Intelligence solution or BI tool, or if you wish to upgrade your business intelligence and reporting tools, look for a solution that has self-serve cross tabulation, or cross-tab reporting. Cross-Tab reporting reveals the relationship between two factors or targets. This analytical tool can be used for side-by-side comparisons and to compare results for one or more data points, variables, or targets.
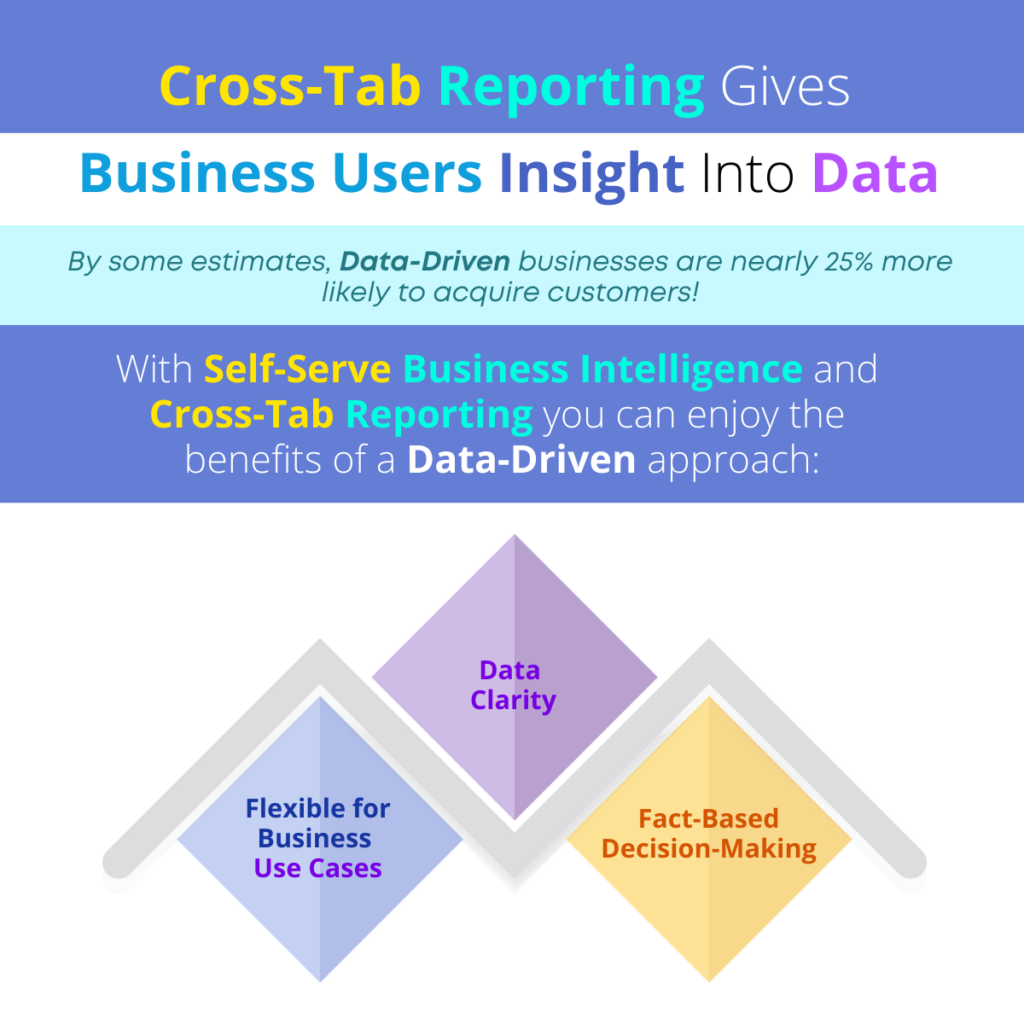
Did you know that, by some estimates, data-driven businesses are nearly 25% more likely to acquire customers? If you can give your team easy-to-use BI tools with self-serve cross-tab reporting, you can put the power of market and customer knowledge in their hands!
‘Business Intelligence solutions with self-serve cross-tab reporting can provide an intuitive, clear method of data analysis for your business users by revealing relationships in a way that makes the results clear and helps the organization to make the best decisions.’
In this article, we discuss the value of self-serve BI tools with Cross-Tab capabilities and the benefits of this type of focus and insight.
Benefits of Self-Serve Cross Tabulation Reporting
Flexible for Business Use Cases
Cross-tab reporting allows for intuitive use by business users with average technical skills, and can be beneficial for all types of business functions and industries. In an educational setting, a university or school might use cross-tab reporting to analyze teacher or course evaluations, looking at the relationship between student satisfaction and the subject, the class time, class location and other factors. Businesses can analyze team and employee satisfaction and attrition by looking at job location, benefits, the results of exit interviews, available training, and support, etc. Cross-tab reporting is frequently used in market research to analyze the various factors that relate to product or service satisfaction, including product features and options, where and how the product is sold, the sales and marketing approach, etc. A retail store owner might use cross-tab data analysis to determine customer satisfaction by looking at demographics, the gender of the person buying the product, the price of the product in a particular region, etc.
Data Clarity
There are many ways to slice and dice data and many ways in which crucial information can hide inside that data. The self-serve cross-tab reporting approach allows business users to examine relationships among data points and factors, with more clarity and accuracy. This type of analysis provides more clarity and reveals results, interdependent relationships and factors that might otherwise be missed. Users can avoid confusion when working with data and analyze large datasets to reveal frequencies and percentages. With this information, the business can understand the ‘what if’ of the various factors and see how results would change if one factor or relationship is changed.
Fact-Based Decision-Making
Self-serve cross-tab reporting simplifies analytics and allows business users to spot trends and patterns and collaborate with other team members to adapt tasks and activities to resolve issues and/or capitalize on opportunities. Using cross tabulation reporting to understand the connection and relationship between two or more factors allows the business to make a decision, with confidence. Rather than guessing the reason for declining results, increased employee attrition or other problems, the enterprise can clearly see what factors (and the relationships among factors) are the cause of a problem and how to change those factors to get better results.
‘If you can give your team easy-to-use BI tools with self-serve cross-tab reporting, you can put the power of market and customer knowledge in their hands!’
Business Intelligence solutions with self-serve cross-tab reporting can provide an intuitive, clear method of data analysis for your business users by revealing relationships in a way that makes the results clear and helps the organization to make the best decisions. By giving your team members these tools, you can leverage domain and industry knowledge and combine data analytics in a day-to-day environment without the need for assistance from data scientists or the IT staff. Self-Serve Cross-Tab reporting produces clear results that are easy to understand and can be used in staff meetings and presentations to support recommendations and help the business become more agile.
Look for seamless Business Intelligence Reporting And Flexible Tools that include self-serve Cross-Tab reporting. Provide business intelligence that your IT team can easily implement and support, and a solution that business users will want to adopt. Choose flexible, agile business intelligence solutions that can be used at all levels to collaborate, share data, and report and communicate with clarity. Self-Serve BI Tools can provide your business with the foundation to achieve your data democratization and user adoption goals.
Original Post : Cross-Tab Reporting Gives Business Users Insight Into Data!
If You Want Business Users to Embrace BI Tools, You Need to Focus on Simplicity!
If your enterprise has not already adopted business intelligence tools, it is missing a crucial benefit in competitive positioning and accurate, dependable decision-making. If your organization has implemented BI tools, but you are falling short on user adoption success, return on investment (ROI) and total cost of ownership (TCO), it is probably because the business intelligence solution is not meant to support business users.
PC Magazine says that, as business users are asked to leverage BI tools, the enterprise must focus on simplicity to engender user adoption.
‘When your team can access BI tools that support the way they work and provide meaningful views and features to easily integrate with work and business processes, user adoption is easier and more immediate.’
To achieve your enterprise goals, ensure user adoption and get the most out of your investment, you must focus on two things: user-friendly features and function and sophisticated analytics.
In this article, we list some of the considerations for business intelligence solution selection or product upgrade. This list is meant to help you assess your current solution, and/or review the capabilities of any BI tool you are considering.
Simplicity in Technology:
- 100% browser-based solution
- Intuitive interface
- Mobile application that is suitable for iOS and Android
- Simple, affordable licensing
- Rapid implementation (roll out in minutes, not months)
- Simple, multi-layered access and user rights management
- Simple architecture
Simplicity of Use:
- Ability to personalize dashboards
- KPI Reporting
- Easy-to-use reporting tools
- Collaborative features
- Social BI for sharing, ranking and commenting
- Smart Data Visualization
- Assisted Predictive Modeling
- Self-Serve Data Preparation
- Clickless analytics for easy searching and results
The business intelligence tools you select can and should include out-of-the-box, ready-to-use features that are designed to support your applications, your industry, and/or your business function. When your team can access BI tools that support the way they work and provide meaningful views and features to easily integrate with work and business processes, user adoption is easier and more immediate.
‘To achieve your enterprise goals, ensure user adoption and get the most out of your investment, you must focus on two things: user-friendly features and function and sophisticated analytics.’
Look for Ready-To-Use Tools that users will want to adopt. Provide business intelligence that your IT team can easily implement and support, with features your users will readily leverage. Choose flexible, agile business intelligence solutions that can be used at all levels to collaborate, share data, and report and communicate with clarity. Self-Serve BI Tools can provide your business with the foundation to achieve your data democratization and user adoption goals.
Original Post : BI Tool User Adoption Depends on Simplicity!
Why It’s Important to Include Cross-Tab Deep Dive in Self-Serve BI Tools!
When a business decides to implement a self-serve business intelligence (BI solution, it must ensure that the tools really are ‘self-serve’ and that they provide the flexibility and agility to give power users the ability to create and analyze, and business users with average technology skills the ability to quickly and easily understand the augmented analytics tools they now have access to, and to use those tools to the benefits of the team and the organization.
The Mobile BI Market is Growing! Make Sure You Select the Right Solution
In today’s mobile society, no enterprise can afford to overlook the importance of mobile access for business applications. Your team may be working remotely, or out of the office meeting with clients or a sales team. Whatever the case, mobile access to apps is crucial to productivity and collaboration. Business Intelligence solutions are no exception!
‘If the mobile BI solution is not flexible and seamless so that it operates on all devices; if it does not provide all features and functionality in a mobile environment, business users will be frustrated.’
According to recent research, the global mobile analytics market is projected to reach $28 million USD within the next decade. The reasons for that growth include an expanded interest in data democratization and the use of analytics among team members throughout the business organization, as well as a need for mobile access to optimize resources and ensure productivity.
The choice of solution is key to success and any mobile BI solution the business considers must support both Android and iOS, and operate in a ‘design once, use anywhere’ approach that accommodates desktops, tablets, and smart phones with an intelligent, adaptive user interface (UI) that supports any screen resolution and any size screen with seamless navigation and performance.
Anytime, Anywhere – Team members are more tech savvy today and they will not accept or adopt solutions that are restrictive or cumbersome. A mobile business intelligence solution must provide support for a fast-paced work environment and support users in the office and on the road.
Designed to Support Growth and Change – The mobile BI solution must support growth and be flexible to expand user volume, multiple locations and changes in business processes, reporting needs, etc.
Integrated Data Access – The mobile BI solution must be easy to use and operate out-of-the-box without customization to enable access to data for analytics, working across disparate data sources to serve seamless, clear information on mobile devices.
Comprehensive Features – Features should include the ability to personalize dashboards, report features including graphs and charts and key performance indicators (KPIs). Solutions that restrict access to all features on mobile devices will not serve your business users well.
‘The choice of a mobile BI solution is key to success. It must support both Android and iOS, and operate in a ‘design once, use anywhere’ approach that accommodates desktops, tablets, and smart phones with an intelligent, adaptive user interface (UI).’
It is important to understand that simply having mobile access is not enough. If the mobile BI solution is not flexible and seamless so that it operates on all devices; if it does not provide all features and functionality in a mobile environment, business users will be frustrated and are not likely to adopt and use the solution on a daily basis which will negatively impact return on investment (ROI).
Mobile BI and Business Intelligence solutions should include tools and techniques that make it easier to achieve data literacy and provide data analytics access to all business users. Simple, self-serve BI tools can provide your business with the foundation to achieve your goals with features and tools like Social BI, Embedded BI, etc. Let us help you achieve your vision and improve productivity and insight across the organization.
Original Post : Mobile BI Ensures Access to Critical Data for Business Users!
Don’t Be Daunted by the Challenges of BI Tools. Self-Serve BI is the Answer!
Gartner research reveals that, ‘90% of corporate strategies will explicitly mention information as a critical enterprise asset and analytics as an essential competency.’ As business professionals, we all know that information is power and today, your business users are expected to know more and to keep pace with industry, market and customer changes that will negatively impact the business or have provide potential opportunities. But how do your team members achieve these goals when they are busier than ever, and the changes are coming more rapidly than ever!
‘Simple, self-serve BI tools can provide your business with the foundation to achieve your goals with features and tools like Social BI, Mobile BI, Embedded BI, etc.’
In this article, we will discuss the topic of modern business intelligence tools and solutions and the advantages of providing self-serve tools to your users for day-to-day analysis and intelligence gathering.
First, let’s look at some of the challenges you will need to consider when implementing self-serve BI tools:
Challenges of Self-Serve BI
- Technology Access and Infrastructure Readiness – Your IT, finance and management teams will need a comprehensive understanding of your current technology and infrastructure, the data hubs, data warehouses and software solutions (legacy, best-of-breed, ERP, etc.) that will provide the foundational data for your users. You will need a plan and a roadmap to integrate these into your business intelligence strategy. A modern, seamless BI solution can provide a simple solution for what might otherwise be a challenging situation. If you can easily integrate your data sources and make them available for data gathering and analytics, your users can leverage the data to report, share and collaborate.
- Team Member Adoption and Understanding – Your team will also need an understanding of the average technology skills of your business users and their willingness to adopt new tools and solutions. If your team members perceive that your BI tools are difficult to use, or if they are not educated on the need for and the benefits of self-serve business intelligence, they are unlikely to adopt the new tools. If, on the other hand, they see the value to their role and how it can make them more productive and streamline their work process; if they see that the solution is easy and intuitive to use, your business is less likely to face the challenges of team reluctance.
There are many other challenges and considerations that should inform your BI tools strategy, but these two are perhaps the most important.
Now, let’s consider some of the many benefits of self-serve business intelligence and how it can support your goals and simplify the lives of your business users:
Benefits of Self-Serve BI
- Social BI – Social BI allows users to champion the use of business intelligence. Power users and those who are curious by nature will create reports, share and collaborate, using easy-to-use tools and thereby encourage others to use the tools and to repurpose report formats etc. to achieve their own goals. Social BI allows business users to share, ‘like’ and perform tasks in a way that is similar to social networking and is therefore popular among business users.
- Mobile BI – Today’s team members often work remotely, or spend a lot of time on the road. By providing self-serve business intelligence that is intuitive to use and accessible on Android and iOS devices, the business can ensure that users will have seamless access and can accomplish tasks, search for information, share and collaborate, without missing a beat!
- Data Democratization and Data Literacy – If you want your team members to grow and add more value, you want to encourage data literacy and ensure data democratization. Move away from restricted data access and sole ownership of analytics by data scientists, IT and business analysts. Provide easy-to-use tools that allow for simple search analytics in a Google-type environment and will make it easier for reluctant business users to embrace your new BI solution and develop new data analytics skills they can use for fact-based decisions.
- User Adoption – There is nothing more frustrating than spending the time and money to implement a new solution, only to find that your users are resistant to using that solution. With true self-serve BI tools and intuitive data visualization, reporting, analytics and access, users will want to adopt the tools and share their discoveries with other team members.
- Embedded BI – If you want to leverage existing technology, improve your Return on Investment (ROI) and Total Cost of Ownership (TCO) for your current solutions and infrastructure, consider that self-serve BI tools can be embedded into existing solutions. With embedded BI with Integration APIs, users can leverage familiar, favorite software solutions in a single sign-on environment, and find information within those solutions without having to learn complicated new techniques or fighting with data silos and transferring data from one place to another.
There are many other advantages to Self-Serve Business Intelligence. This short list should give you some ideas of how you can leverage these tools in your own business landscape.
‘As business professionals, we all know that information is power and today, your business users are expected to know more and to keep pace with industry, market and customer changes that will negatively impact the business or have provide potential opportunities.’
Business Intelligence solutions should include tools and techniques that make it easier to achieve data literacy and provide data analytics access to all business users. Simple, self-serve BI tools can provide your business with the foundation to achieve your goals with features and tools like Social BI, Mobile BI, Embedded BI, etc. Let us help you achieve your vision and improve productivity and insight across the organization.
Original Post : Let’s Discuss: Benefits and Challenges of Self-Serve BI!
Ensure Business Users Will Adopt BI Tools with Self-Serve BI and Cross-Tab Analytics!
Gartner has predicted that, ‘90% of corporate strategies will explicitly mention information as a critical enterprise asset and analytics as an essential competency.’ Establishing the strategy is one thing, but getting business users to adopt an analytics and information-based business workflow is quite another.
‘Modern business intelligence tools that are designed with self-serve features makes it easy enough for every user (no matter their technical skill) to leverage analytics to report, share and collaborate.’
When it comes to teams, there are two things that are always true: 1) they learn a process and workflow and rarely want to change that familiar process and 2) they are always suspicious of ‘new’ initiatives and nearly always believe that these new initiatives will result in more work for them. There is a reason your team resists new processes and initiatives and that reason is simple. Usually, their fears are warranted!
So, if you want to engender support for new analytics initiatives and engage a business community in fact-based, action-oriented initiatives, you need to plan this new initiative with your users in mind.
In this article, we focus on two of the primary components of a new business user analytics initiative.
Self-Serve BI Tools
Modern business intelligence tools that are designed with self-serve features like smart data visualization, self-serve data preparation and assisted predictive modeling make it easy enough for every user (no matter their technical skill) to leverage analytics to report, share and collaborate. By adding value to the user’s everyday tasks and reducing the rework and issues they will confront, you can encourage your users to adopt analytics initiatives.
- Any promotion of analytics strategy must clearly illustrate business use cases and benefits of these tools.
- Support a more productive, streamlined environment that will allow them to do more with less and get the job done quickly.
- Ensure that business users can collaborate and share and grow their own expertise and visibility.
- Provide measurable results and information to make recommendations and support those recommendations.
Cross-Tab Analytics Capabilities
Those self-serve tools should include reporting and graphical tools that are clear and concise. Business users don’t want tools that produce complex reports filled with columns and mind-numbing numbers that do not help them reach a decision or illustrate an issue. Cross-tab analytics have been around for some time but the new, improved versions of this capability provides real insight into data in a way that is clear for every user. Sophisticated functionality is underpinned with easy-to-use tools so users can analyze the relationship between or among two or more variables and summarize data in rows and columns making it easy to understand the relationships and intersection of the various types of data. Understanding relationships in data is crucial to identifying the root cause of a problem or to targeting an issue or identifying a business opportunity. Your team members can work with multi-dimensional data and perform ad-hoc queries to gain a clear view of performance, dive into your data, and find and understand the data they need quickly and intuitively. Cross-tab analysis simplifies complex data operations, summary operations, time series functions, filters and custom column expressions and enables business users with simple tools they can really use.
‘If you want to engender support for new analytics initiatives and engage a business community in fact-based, action-oriented initiatives, you need to plan this new initiative with your users in mind.’
Business Intelligence tools can improve your business results. If your business understands the challenges of implementing a business intelligence solution and adequately plans for implementation and user adoption, it can leverage the benefits of these tools and solutions and ensure success. Let us help you achieve your vision and improve productivity and insight across the organization.
Original Post : Enable User Adoption with Self-Serve BI and Cross-Tab Analytics!